
Five percent was supposed to break the Treasury market.
Instead, it first broke the people positioned for yields to fall.
The US 10-year yield has now reached 5.18%. More importantly, the 10-year real yield—the return after expected inflation—has climbed to 2.85%.
That changes the story. This is no longer only an inflation scare. It is a genuine tightening in the cost of money.
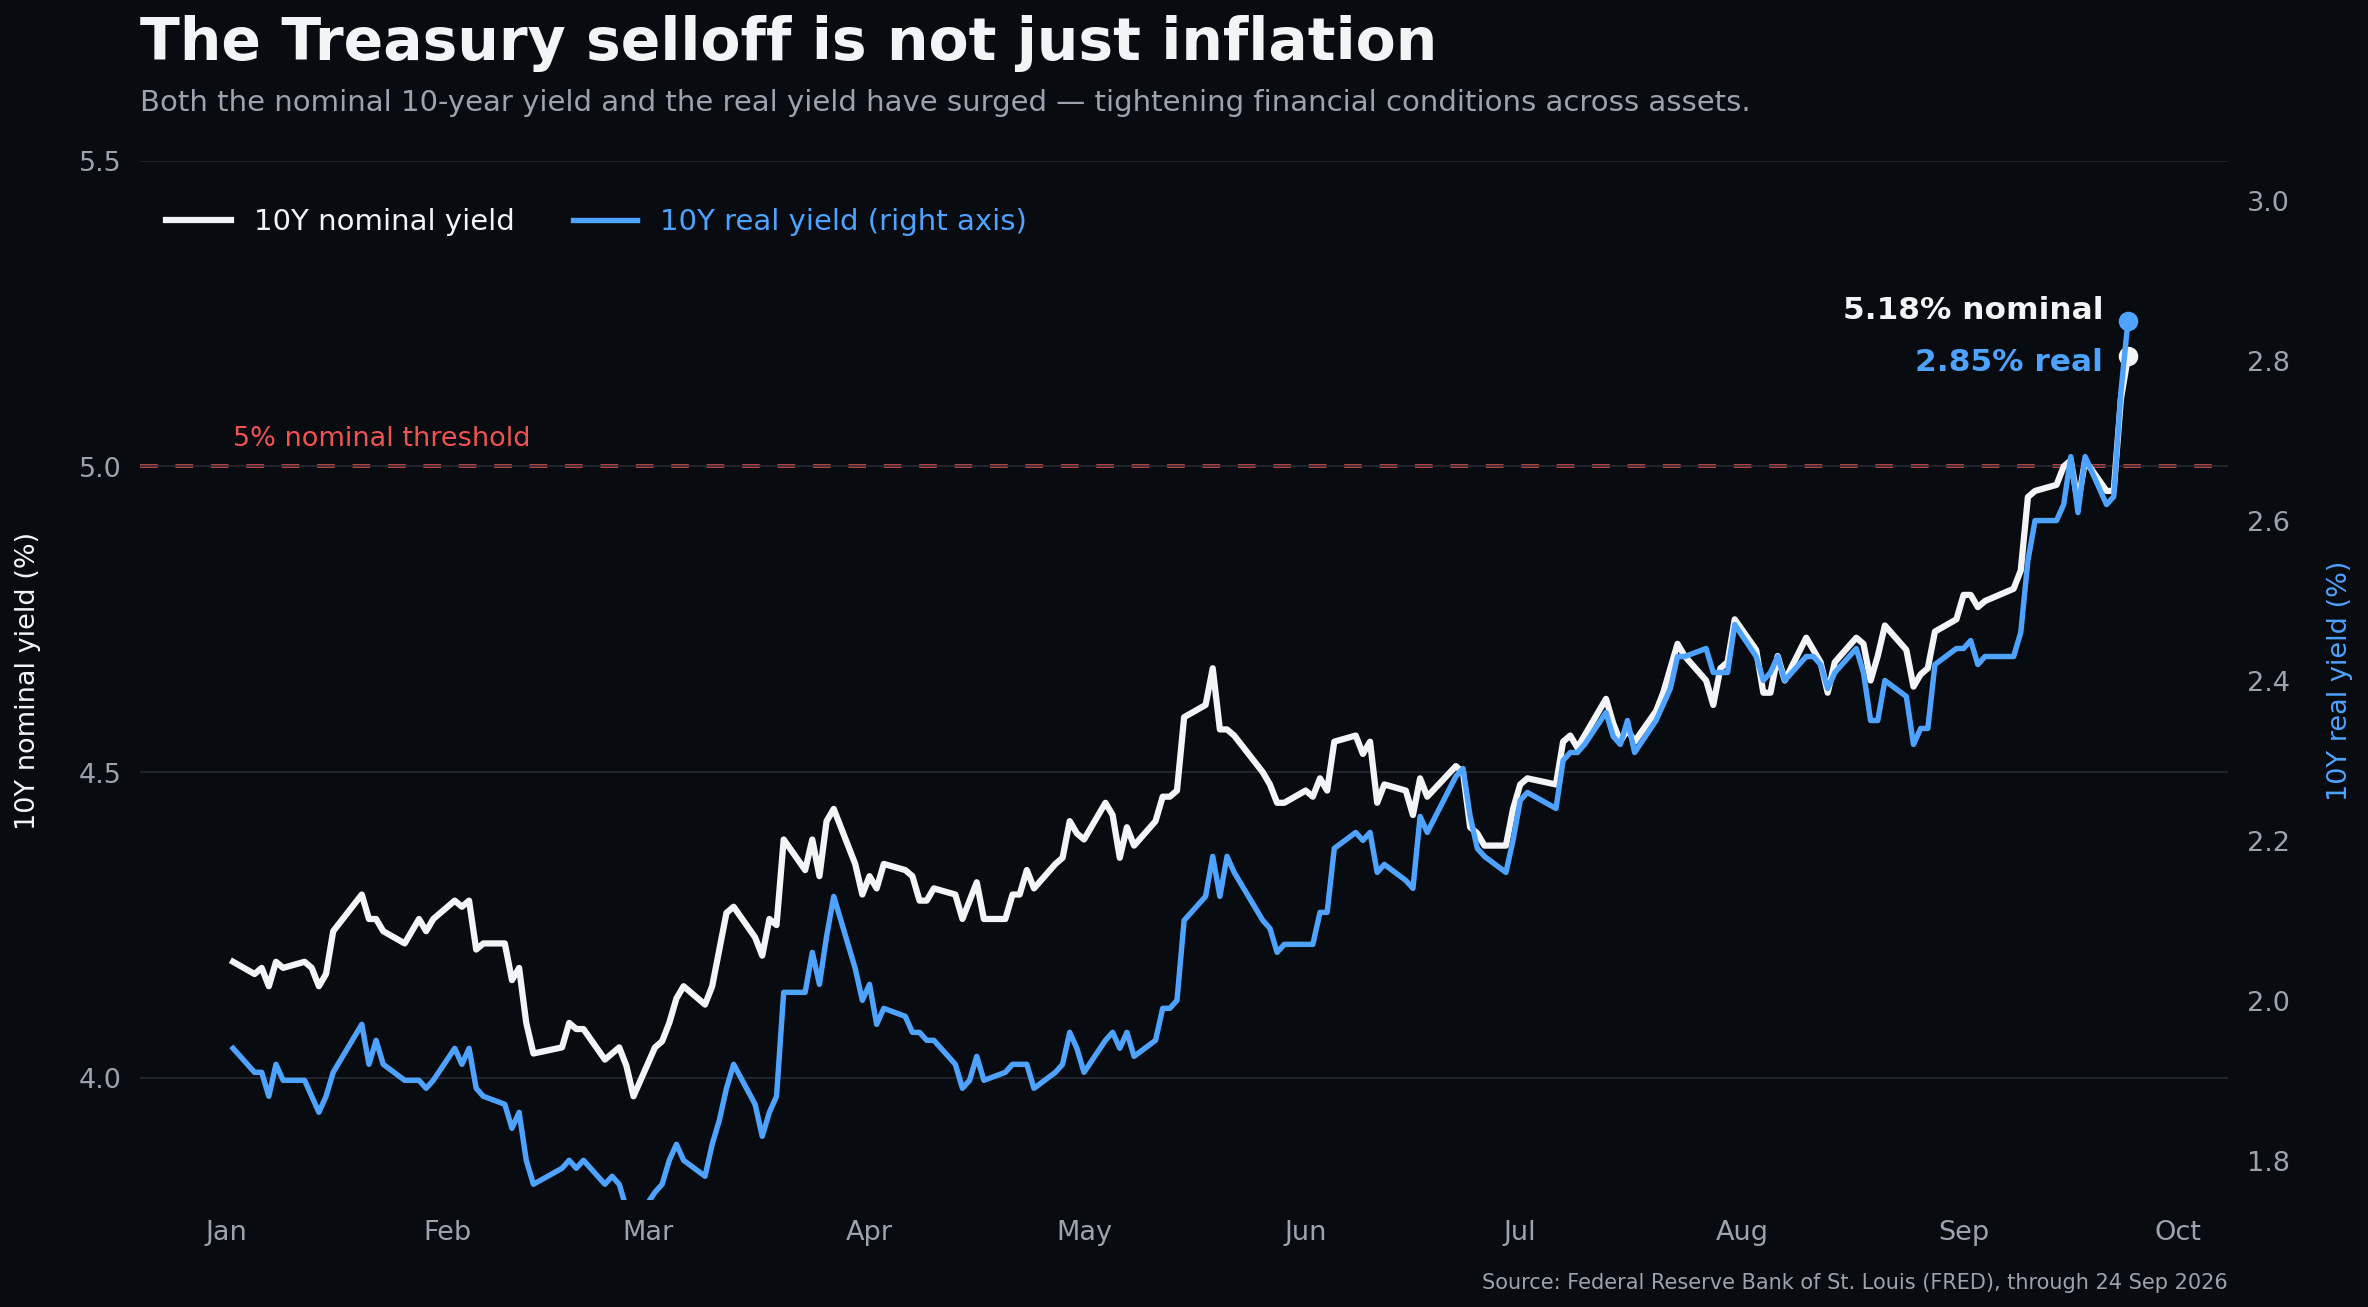
At these levels, Treasuries are not moving in isolation. A 5%-plus 10-year feeds into mortgages, corporate funding, equity valuations and Washington's own interest bill. The long end has entered a zone where every additional rise in yield creates more pressure on the economy supporting that rise.
That does not guarantee the top is in. But it makes 5.2% an unusually important level.
The squeeze came before the slowdown
The speed of the move matters. The 10-year rose from 4.96% to 5.18% in three trading sessions, while real yields surged with it.
Yet the usual signs of an economy cracking are still missing.
The Federal Reserve expects US growth of 2.3% in 2026 and unemployment of 4.1%. Its problem is inflation: policymakers project headline PCE inflation at 3.7% and core PCE at 3.4%. The median year-end policy-rate projection has risen to 4.1%, from 3.8% in June.
Credit markets tell a similarly complicated story. A recent global credit study estimates US recession risk at only 16% over the coming year. Corporate leverage and interest coverage remain relatively healthy, and most fixed-rate borrowers do not feel higher market yields immediately. Much of the approaching maturity wall does not arrive until 2028.
In other words, the yield is high enough to hurt—but the economy may be strong enough to tolerate the pain longer than traders expect.
This is the main risk in calling the top. “Unsustainable” is not the same as “about to reverse.”
Washington wants lower yields. That does not mean it can command them.
The political incentive is obvious.
High mortgage rates hurt housing. High Treasury yields compete with equities and credit. Rising government interest expense also makes every fiscal promise more costly.
The Treasury has already doubled the maximum size of its liquidity-support buybacks in the 10-to-30-year sectors, from $2 billion to at least $4 billion per operation. That is a meaningful response to stress in the long end.
But it is not yield-curve control.
Buybacks can improve liquidity and remove cheap, less-traded securities. They cannot erase inflation, heavy issuance or the extra compensation investors demand for holding long-dated government debt.
There is even a paradox here. If markets interpret official intervention as an attempt to suppress yields without addressing inflation or fiscal supply, the response could be a weaker dollar and a higher term premium. The policy designed to cap the long end could make investors more suspicious of it.
The “policy put” probably exists. Its strike price—and its effectiveness—remain unknown.
What regime are we actually in?
The market is not yet trading benign disinflation. It is trading resilient growth, persistent inflation and a higher fiscal term premium.
That combination explains why the 10-year yield can reach 5.2% without causing an immediate recession—and why expensive, rate-sensitive assets remain vulnerable even after the bond selloff looks stretched.
There are signs that the move is entering a late stage. Real yields have risen quickly, positioning has been forced out and political pressure is building. But the evidence still points to a prospective transition, not a completed one.
The tactical opportunity is therefore to prepare for the next regime without pretending it has already arrived.
One macro outcome, several very different trades
The natural response to a peak in yields is to look beyond bonds. Falling real yields would also support QQQ, gold and Bitcoin.
But that is not four separate ideas. In the most important scenario, it is one idea expressed four times: easier financial conditions.
| Macro regime | TLT | QQQ | Gold ETF | Bitcoin |
|---|---|---|---|---|
| Benign disinflation and policy relief | Strong | Strong | Strong | Strong |
| Current: fiscal and inflation repricing | Under pressure | Resilient but vulnerable | Mixed, with a structural bid | Fragile |
| Growth or credit accident | Strong | Weak | Strong | Mixed to weak |
| Yields stabilize while growth holds | Carry-positive | Modestly positive | Range-bound | Liquidity-dependent |
The best outcome is straightforward: inflation eases, yields retreat and growth survives. TLT rallies, QQQ's valuation headwind recedes, gold benefits from lower real rates and Bitcoin catches the liquidity tailwind.
The dangerous outcome is equally clear. If the rise in yields reflects persistent inflation and fiscal risk, TLT, growth equities and Bitcoin can all fall together. What looks diversified on a brokerage statement may be the same macro position underneath.
Gold is the partial exception. It can benefit if the policy response undermines confidence in fiscal or monetary discipline. But even gold may struggle initially if real yields continue rising.
This leads to a more selective conclusion. The bond market offers improving value, but the equity and crypto trades still need confirmation that lower yields will arrive through disinflation rather than economic damage.
What would confirm the turn?
A high yield is a valuation argument, not a timing signal.
The first confirmation would be a clear rejection of the 5.2% area, followed by a move back through roughly 5.05%. A sustained break below 5% would matter more: it would suggest the market has absorbed the latest inflation and supply shock.
Cross-asset behavior would then help explain why yields are falling.
If Treasuries rally alongside equities and tighter credit spreads, the market is probably pricing benign disinflation. If Treasuries rally while equities fall and credit spreads widen, the signal is less comforting: something may be breaking.
The next major test is the September 30 PCE report. Softer inflation could turn an overstretched selloff into a sharp duration rebound. A stronger reading would support the Fed's higher-for-longer message and leave the long end vulnerable to another leg higher.
The reaction may be more revealing than the data. If Treasuries cannot rally on softer inflation or supportive official measures, the market is saying the repricing is structural.
Turning the view into an investable portfolio
The cleanest implementation is a concentrated portfolio rather than a collection of overlapping versions of the same trade. QQQ is sufficient for US equity exposure. TLT provides the liquid, high-convexity expression of a long-end reversal, while a gold ETF protects against the possibility that fiscal or policy stress persists even as officials push for lower yields.
| Instrument | Portfolio role | Why |
|---|---|---|
| TLT | Primary reversal trade | Deep liquidity and strong convexity if the long end turns; also the portfolio's largest source of risk if the term premium keeps rising |
| Gold ETF: GLDM or IAU | Macro hedge | Protects against fiscal stress and policy-credibility risk, although rising real yields remain a near-term headwind |
| QQQ | Sole US equity expression | Captures the valuation relief from falling real yields without duplicating the exposure through another US index |
| CapitaLand Ascendas REIT (CLAR) | SGD income and rates satellite | Benefits from lower funding pressure, but leverage and property fundamentals make it more than a simple bond proxy |
| Spring Airlines (601021.SH) | China recovery satellite | Offers exposure to Chinese travel demand, but margins remain sensitive to fuel costs and fare competition |
| Bitcoin | Small liquidity option | Can respond strongly to easier liquidity, but provides little protection if the bond selloff remains inflationary |
An illustrative allocation is deliberately unequal:
| Asset | Weight | Purpose |
|---|---|---|
| TLT | 35% | Core long-end yield-reversal position |
| Gold ETF | 25% | Hedge against fiscal stress and a loss of policy credibility |
| QQQ | 22% | Equity upside if falling real yields arrive without a recession |
| CapitaLand Ascendas REIT | 10% | SGD income and Singapore rate-reversal exposure |
| Spring Airlines | 5% | China travel and consumption recovery option |
| Bitcoin | 3% | Limited upside option on a broader liquidity turn |
This is not a conventional diversified portfolio. It is a tactical portfolio built around one macro transition, with gold providing the main counterweight. TLT and QQQ can still fall together if real yields continue rising, which is why the position sizes should not be mistaken for six independent sources of risk.
Nor should the entire allocation be entered in one session. One approach is to establish half of each target first, add another quarter if the 30-year yield closes below roughly 5.30%, and complete the final quarter only after the 10-year establishes itself below 5% and real yields turn lower. The uncommitted portion can remain as temporary brokerage cash rather than becoming a strategic asset allocation.
TLT deserves particular care. Its effective duration is close to 15 years, so a 50-basis-point move in long yields can translate into a price move of roughly 7% before carry and convexity. If the 10-year instead records a sustained weekly close above 5.35%, or the 30-year establishes itself above 5.65%, the duration thesis has not been confirmed and the TLT position should be reduced rather than averaged mechanically.
The hierarchy is therefore clear: TLT expresses the reversal, gold ETF insures the policy risk, QQQ follows confirmation, and the remaining positions stay small.
The opportunity—and the trap
The 10-year at 5.2% has entered the policy pain zone. Real yields are restrictive, financial conditions are tightening and the political desire for lower borrowing costs is becoming stronger.
That makes a tactical rebound increasingly plausible.
But the more interesting conclusion is not simply that yields are “too high.” It is that the Treasury market is approaching a reflexive point: high yields may soon weaken growth, risk assets and inflation enough to create their own reversal.
The opportunity is to recognize that turn early.
The trap is to assume it must happen immediately—and to express the same view across every asset before the bond market confirms it.
At 5.2%, the long end is worth watching closely. The next move will tell investors whether this was the final squeeze before relief, or the beginning of a more structural repricing in the world's most important interest rate.
Research notes
- UBS Global Strategy, Higher Rates Will Create Winners and Losers Before Defaults, 23 September 2026. Its proprietary credit model estimates 16% US recession risk over the following 12 months and finds that roughly 75% of the next two years' maturities fall in 2028.
- Federal Reserve, H.15 Selected Interest Rates, 25 September 2026.
- Federal Reserve, Summary of Economic Projections, 16 September 2026.
- US Treasury, Increased Sizes of Nominal Long-End Liquidity Support Buybacks, 19 August 2026.
- Bureau of Economic Analysis, release schedule for Personal Income and Outlays, August 2026.